Videos 

We have developed a range of video content that explains visually how NeuroLynQ works and also includes some interesting content from previous studies we have undertaken.

Featured

Shimmer’s NeuroLynQ system being used to analyze the nonconscious responses of a group of Republicans and a group of Democrats to compare their responses to President Biden’s joint address to Congress.

An explanation of how NeuroLynQ was used to understand response to the Democratic Debate held in February 2020.

All Videos

Geoff Gill, President of Shimmer Americas, recently sat down with Bob Lederer on the RBDR podcast to discuss the moves being made towards the standardization of critical neuroscience research elements.

During the first 2020 presidential debate, a team from Shimmer, Schlesinger Group, IVP Research Labs, and HCD Research used Shimmer's NeuroLynQ biometric monitoring system to stream the non-conscious responses of viewers of the debate. Our measure focused on what psychologists call "arousal" which indicates a wide variety emotions, including excitement, interest, anger, or even fear. We separated three segments: Trump supporters, Biden supporters, and Undecideds. To say the results were interesting is an understatement. This video shows a short clip from our live feed. It includes the point where Biden told Trump to shut up which, as you can imagine, got a significant reaction.

Shimmer tracked the emotions of participants from the Philadelphia area as they watched President Biden’s first joint address to congress. This study is a carryover from the Presidential debate studies carried out last year.

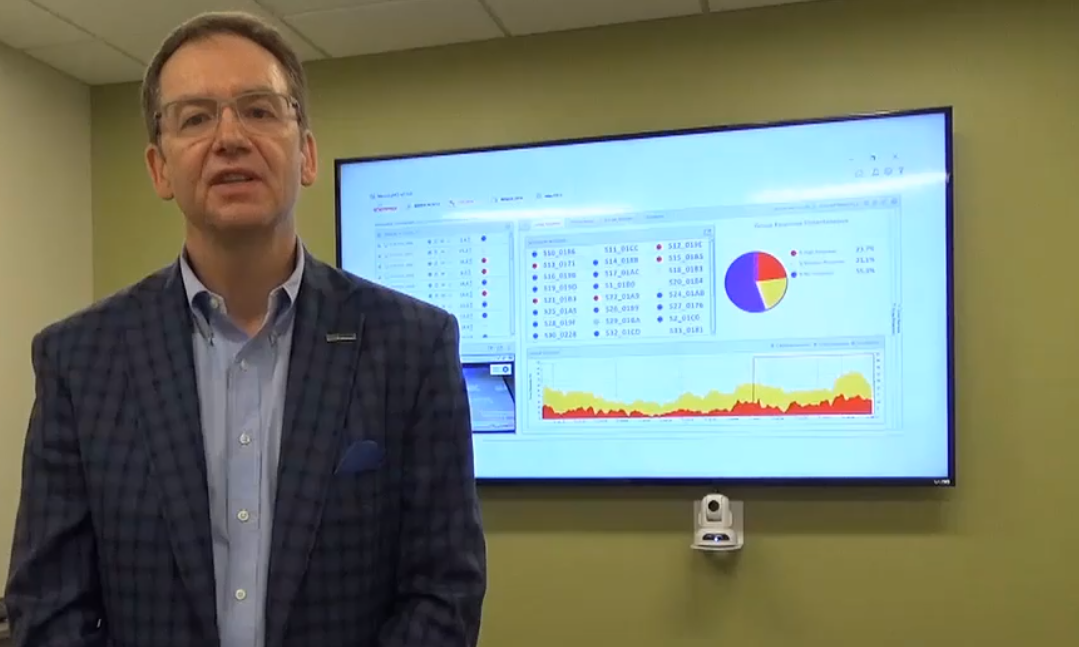
An audience of 45 US voters emotional responses were measured as they they viewed the first presidential debate of 2020. GSR and ECG biometric signals were captured to understand the subjects responses. In this video the yellow graph represents the % of the audience experiencing moderate response, while the red graph indicated the % of the audience who are having a high response at each moment of her speech.

 
This video outlines the main unique features the NeuroLynQ software has to offer. The main dashboard collecting data from up to 45 persons, using event markers, aggregating data from multiple data collection sessions and the video assistant feature are explained.
This video gives a brief introduction into setting up the NeuroLynQ system to begin collecting data. We introduce the hardware required and configure the NeuroLynQ software to begin collecting data. This video is a precursor to the NeuroLynQ Software Advanced Features video which will go into much greater depth explaining the unique features of NeuroLynQ.
 

Brexit Case Study - Shimmer Research and Bellwether Citizen Response teamed up using the NeuroLynQ™ biometric measurement system to tap into voters’ deepest sentiments on Brexit. An audience of 30 persons were exposed to 11 different Brexit figures discussing various issues related to Brexit. NeuroLynQ captured GSR and ECG data to measure the audience's emotional reactions to each figure.

Donald Trump on Brexit - This video captures the emotional responses of 30 people watching Donald Trump discuss Brexit in realtime. GSR and ECG signals were captured to understand the subjects responses. In this video the blue line represents the % of the audience experiencing some response, while the red line indicated the % of the audience who are having a high response at each moment of his speech.


This video captures the emotional responses of 30 people watching Nancy Pelosi discuss Brexit and the Good Friday Agreement in realtime. GSR and ECG signals were captured to understand the subjects responses. In this video the blue line represents the % of the audience experiencing some response, while the red line indicated the % of the audience who are having a high response at each moment of her speech.

Bloomberg 'Joke I made' comment - NeuroLynQ measures the emotional reaction of a group of 30 voters as Michael Bloomberg and Elizabeth Warren debate. In this video the blue line represents the % of the audience experiencing some response, while the red line indicated the % of the audience who are having a high response at each moment of the debate.

 
Peabody Essex Museum (PEM), a leading art and history museum, used NeuroLynQ Mobile in a series of studies to understand how visitors interact with their art exhibits with the ultimate goal of improving the visitor experience.
This video captures the emotional responses of 45 people watching the Tide Ads aired during Super Bowl LII in realtime. GSR and ECG signals were captured to understand the subjects responses. In this video the green line represents the % of the audience experiencing some response, while the orange line indicated the % of the audience who are having a high response at each moment.
 
Biometric trace generated by NeuroLynQ during Rob Gronkowski's catch versus the Rams.
This video captures the emotional responses of 38 people watching the Mercedes-Benz 2019 A-Class Say the Word Super Bowl Commercial aired during Super Bowl LIII in realtime. GSR and ECG signals were captured to understand the subjects responses.
 
This video captures the emotional responses of 38 people watching the 100 Billion Words SimpliSafe Fear Is Everywhere Commercial aired during Super Bowl LIII in realtime. GSR and ECG signals were captured to understand the subjects responses.
This video captures the emotional responses of 38 people watching the Not Everything Makes the Cut Amazon Super Bowl Commercial aired during Super Bowl LIII in realtime. GSR and ECG signals were captured to understand the subjects responses.
 
This video captures the emotional responses of 38 people watching the 100 Billion Words Google Super Bowl Commercial aired during Super Bowl LIII in realtime. GSR and ECG signals were captured to understand the subjects responses.
This video captures the emotional responses of 45 people watchingAds aired during a Fifa World Cup game in 2018. GSR and ECG signals were captured to understand the subjects responses. In this video the grey line represents the % of the audience experiencing some response, while the purple line indicated the % of the audience who are having a high response at each moment.
 
Introducing how the mind works and it's impact on neuroscience
 
This video discusses the key biometric signals used in neuroscience and their impact
This video explains the key metrics that the NeuroLynQ platform outputs and how they can be interpreted for neuroscience
 

This video describes the advantages of using biometric data to analyse subjects

This video discusses how the NeuroLynQ platform has been used and validated in data collection use to date
 

How The Peabody Essex Museum Uses Neuroscience To Understand Art

During the first 2020 presidential debate, a team from Shimmer, Schlesinger Group, IVP Research Labs, and HCD Research used Shimmer's NeuroLynQ biometric monitoring system to stream the non-conscious responses of viewers of the debate. Our measure focused on what psychologists call "arousal" which indicates a wide variety emotions, including excitement, interest, anger, or even fear. We separated three segments: Trump supporters, Biden supporters, and Undecideds. To say the results were interesting is an understatement. This video shows a short clip from our live feed.


This video captures the emotional responses of 30 people watching John Bercow with one of his infamous ORDER statements in realtime. GSR and ECG signals were captured to understand the subjects responses. In this video the blue line represents the % of the audience experiencing some response, while the red line indicated the % of the audience who are having a high response at each moment of his statement.

This video captures the emotional responses of 30 people watching Boris Johnson discuss Brexit in realtime. GSR and ECG signals were captured to understand the subjects responses. In this video the blue line represents the % of the audience experiencing some response, while the red line indicated the % of the audience who are having a high response at each moment of his speech.


This video captures the emotional responses of 30 people watching Donald Dusk discuss Brexit in realtime. GSR and ECG signals were captured to understand the subjects responses. In this video the blue line represents the % of the audience experiencing some response, while the red line indicated the % of the audience who are having a high response at each moment of his speech.

This video captures the emotional responses of 30 people watching Nigel Farage discuss UK independence in realtime. GSR and ECG signals were captured to understand the subjects responses. In this video the blue line represents the % of the audience experiencing some response, while the red line indicated the % of the audience who are having a high response at each moment.


This video captures the emotional responses of 30 people watching Jeremy Corbyn discussing benefits of EU membership in realtime. GSR and ECG signals were captured to understand the subjects responses. In this video the blue line represents the % of the audience experiencing some response, while the red line indicated the % of the audience who are having a high response at each moment of his speech.

An audience of 30 people's emotional responses were measured as they watched Arlene Foster discuss Brexit. GSR and ECG signals were captured to understand the subjects responses. In this video the blue line represents the % of the audience experiencing some response, while the red line indicated the % of the audience who are having a high response at each moment of her speech.


An audience of 30 people's emotional responses were measured as they watched Theresa discuss Brexit. GSR and ECG signals were captured to understand the subjects responses. In this video the blue line represents the % of the audience experiencing some response, while the red line indicated the % of the audience who are having a high response at each moment of her speech.